| This documentation is out of date.
The new version of the documentation is here: https://cannylogic.com/docs |
Difference between revisions of "CANNY Lab Simulator"
| [unchecked revision] | [unchecked revision] |
(→Непрерывное исполнение диаграммы) |
(→Приостановка и сброс) |
||
| Line 44: | Line 44: | ||
[[File:4_7_2_5.png]] | [[File:4_7_2_5.png]] | ||
| − | === | + | === Pause and reset === |
| − | + | Execution of diagram by simulator, can pause, selecting ''«Simulator»'' → ''«Pause»'' of main menu or click the button [[File:4_7_3_1.png]] of toolbar, which in this case takes the following form [[File:4_7_3_4.png]]. | |
| − | + | A functional block in which diagram execution has been suspended, will be highlighted in yellow. Networks, with the values has changed in the last step will also be highlighted, simulator clock will be stopped. | |
{| | {| | ||
| − | |valign="top" style="padding-left:0.5em;"|'' | + | |valign="top" style="padding-left:0.5em;"|''Note:'' |
| − | |valign="top" style="padding-left:0.5em;"|'' | + | |valign="top" style="padding-left:0.5em;"|''The items "Start" and "Pause" of menu "Simulator" and buttons [[File:4_7_3_4.png]] and [[File:4_7_3_1.png]] of toolbar are combined and are activated depending on the current state of the simulator.'' |
|} | |} | ||
[[File:4_7_3_2.png]] | [[File:4_7_3_2.png]] | ||
| − | + | If enable auto-tracking option for the current diagram block selecting ''«Simulator»'' → ''«Show block»'' of main menu or click the button [[File:4_7_3_3.png]] of toolbar, display diagram in the workspace is shifted so that the working area contain a functional block on which execution was suspended. | |
| − | + | Continuing diagram execution at a point where it was interrupted, performed by selecting ''«Simulator»'' → ''«Start»'' of main menu or click the button [[File:4_7_3_4.png]] of toolbar. | |
| − | + | Full stop diagram execution process and reset simulator to the initial state performed by selecting ''«Simulator»'' → ''«Reset»'' of main menu or click the button [[File:4_7_3_5.png]] of toolbar. | |
=== Приостановка по условию === | === Приостановка по условию === | ||
Revision as of 14:52, 4 May 2016
Operating in simulator mode, CannyLab performs actions with data of the diagram, equivalent to those to be executed by a controller computing kernel when running diagram on it, that allows simulate the operation of the controller on a PC.
The user can run the simulation of execution the functional diagram for debugging and testing at any stage of its creation. In simulation mode it is possible cycling and stepping through diagram, setting the conditions to pause the execution, forced setting inputs and outputs values of function blocks, control of intermediate values.
| Note: | In the current version of CannyLab simulator there is no support of controller hardware resources, so the reading results from addresses and write to the address in the simulator may differ from the results obtained in diagram execution by the controller. |
Contents
Enabling simulation mode
Enabling and disabling the simulation mode is done by selecting the appropriate item in the «Simulator» of main menu, or by pressing ![]() of toolbar.
of toolbar.
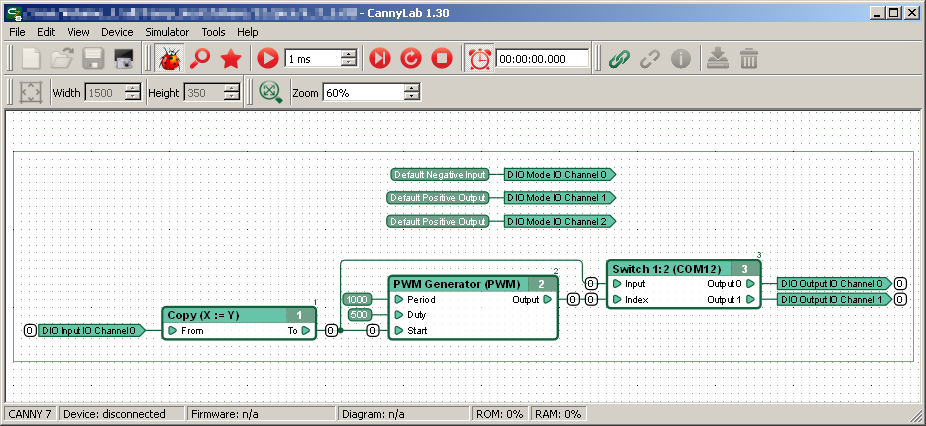
In simulation mode, the appearance of the main window and diagram changes - removed not available in this mode dialog elements, debugging information is added on the diagram.
When the simulation is activated, will be performed a consistency diagram check, count memory (RAM) and program memory (ROM) which require the controller to run it. If problems are found the user will be warned about them.
Also, when the simulation mode is activated will be automatically detected and displayed functional blocks order of execution. All intermediate values of inputs and outputs of functional blocks, blocks internal memory and the value of all the networks will be reset to 0, a pointer to the next block in the execution queue will be set to the first block of the diagram, set simulation clocking to real time.
In simulation mode, the user can freely move around the diagram and change scale, but editing diagram elements in this CannyLab mode is restricted.
Continuous diagram execution
Running a continuous diagram execution by simulator is performed by selecting «Simulator» → «Start» of main menu or click the button ![]() toolbar, which in this case takes the following form
toolbar, which in this case takes the following form ![]() .
.
| Note: | The items "Start" and "Pause" of menu "Simulator" and buttons |
When binding simulator clock to real time ![]() , which is enabled by default in the simulation mode, the simulator clock
, which is enabled by default in the simulation mode, the simulator clock ![]() start the countdown looping diagram execution with a speed of PC system clock. If disable this binding, simulator internal clock will go as fast as possible, determined by the performance of the PC.
start the countdown looping diagram execution with a speed of PC system clock. If disable this binding, simulator internal clock will go as fast as possible, determined by the performance of the PC.
The scale of diagram time ![]() sets the increment that will be added to simulator clock after each pass of the diagram. This parameter can be seen as the time it takes the controller to once full execute of users diagram.
sets the increment that will be added to simulator clock after each pass of the diagram. This parameter can be seen as the time it takes the controller to once full execute of users diagram.
| Note: | To debug a large user diagrams implementing critical to runtime algorithms for PLC CANNY 7 time scale is recommended to set at the rate of 1 ms for every 30 function blocks. |
When changing the values of inputs and outputs of the functional blocks during the execution of the diagram, a new values are displayed on diagram immediately beside them. For clarity, the network connected to the outputs of blocks having a value other than zero, will be highlighted.
Pause and reset
Execution of diagram by simulator, can pause, selecting «Simulator» → «Pause» of main menu or click the button ![]() of toolbar, which in this case takes the following form
of toolbar, which in this case takes the following form ![]() .
.
A functional block in which diagram execution has been suspended, will be highlighted in yellow. Networks, with the values has changed in the last step will also be highlighted, simulator clock will be stopped.
| Note: | The items "Start" and "Pause" of menu "Simulator" and buttons |
If enable auto-tracking option for the current diagram block selecting «Simulator» → «Show block» of main menu or click the button ![]() of toolbar, display diagram in the workspace is shifted so that the working area contain a functional block on which execution was suspended.
of toolbar, display diagram in the workspace is shifted so that the working area contain a functional block on which execution was suspended.
Continuing diagram execution at a point where it was interrupted, performed by selecting «Simulator» → «Start» of main menu or click the button ![]() of toolbar.
of toolbar.
Full stop diagram execution process and reset simulator to the initial state performed by selecting «Simulator» → «Reset» of main menu or click the button ![]() of toolbar.
of toolbar.
Приостановка по условию
В симуляторе предусмотрена возможность автоматической приостановки исполнения диаграммы по следующим условиям:
- при изменении любого значения на диаграмме;
- при изменении значения конкретной сети на диаграмме;
- после исполнения очередного функционального блока диаграммы (пошаговый режим);
- перед исполнением конкретного функционального блока на диаграмме;
- по завершению полного цикла диаграммы;
Включение и выключение опции автоматической приостановки исполнения при любом изменении данных производится выбором пункта «Симулятор» → «До изменения» главного меню программы или нажатием кнопки ![]() панели инструментов.
панели инструментов.
Исполнение очередного функционального блока с последующей приостановкой исполнения диаграммы производится выбором пункта «Симулятор» → «Шаг» главного меню программы или нажатием кнопки ![]() панели инструментов.
панели инструментов.
Выполнение одного полного цикла диаграммы с приостановкой исполнения на текущем функциональном блоке производится выбором пункта «Симулятор» → «Цикл» главного меню программы или нажатием кнопки ![]() панели инструментов.
панели инструментов.
Установка и снятие точки останова на конкретном функциональном блоке диаграммы производится выбором соответствующего пункта контекстного меню, доступного по нажатию правой кнопки мыши на блоке. Фон заголовка функционального блока объявленного точкой останова, в режиме симулятора будет выделен красным цветом.
При наличии на диаграмме функциональных блоков объявленных точками останова, исполнение диаграммы будет приостановлено перед каждым исполнением каждого такого блока.
Установка и снятие точки останова на конкретной сети диаграммы производится выбором соответствующего пункта контекстного меню, доступного по нажатию правой кнопки мыши на любом сегменте сети. Цвет всех сегментов сети объявленной точкой останова, в режиме симулятора будет изменен на красный.
При наличии на диаграмме сетей объявленных точками останова, исполнение диаграммы будет приостановлено при каждом изменении значения каждой такой сети.
| Примечание: | Установить или снять точку останова на сети или функциональном блоке можно также при помощи двойного нажатия левой клавиши мыши на этих элементах диаграммы. |
Принудительное изменение значений
Для имитации внешних воздействий на диаграмму во время симуляции, в симуляторе предусмотрена возможность ручного принудительного изменения текущего значения сетей.
Принудительное изменение значения сети производится выбором пункта контекстного меню «Установить значение» доступного по нажатию правой кнопки мыши на любом сегменте сети.
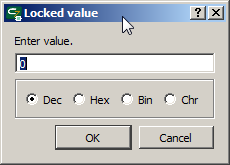
В открывшемся после выбора этого пункта диалоговом окне вводится устанавливаемое принудительно значение.
Значение, принудительно установленное для сети, отображается в виде надписи на черном фоне.
Установленное принудительно значение сети будет использоваться функциональными блоками, соединенными с данной сетью вместо её реального значения до тех пор, пока не будет освобождено вручную.
Возврат сети к получению значения определяемому работой диаграммы производится выбором пункта контекстного меню «Освободить значение» доступного по нажатию правой кнопки мыши на любом сегменте сети с принудительно установленным значением.
Быстро принудительно установить значение какой-либо сети равное единице, или быстро освободить значение сети можно также при помощи двойного нажатия левой клавиши мыши на данной сети, удерживая нажатой клавишу «Ctrl».
Изменение системы счисления отображаемых значений
По умолчанию, все значения отображаются в симуляторе в десятичном виде. Однако, систему счисления отображаемых значений можно в любой момент изменить, например на шестнадцатеричную, выбрав соответствующий пункт подменю «Симулятор» → «Формат значений» главного меню программы.


