| This documentation is out of date.
The new version of the documentation is here: https://cannylogic.com/docs |
Difference between revisions of "CANNY Lab Functional Diagram Editor"
| [unchecked revision] | [unchecked revision] |
(Created page with "Основным режимом работы CannyLab является режим редактора функциональных диаграмм. === Общее описа...") |
m (markup newlines) |
||
| (46 intermediate revisions by 4 users not shown) | |||
| Line 1: | Line 1: | ||
| − | + | The main operating mode of CannyLab is the function diagram editor. | |
| − | === | + | === General description === |
| − | + | The function diagram editor is the main method of working within CannyLab. In function diagram editor mode, the user can: | |
| − | * | + | * Add function blocks to the diagram; |
| − | * | + | * move function blocks within the diagram; |
| − | * | + | * select and delete diagram elements; |
| − | * | + | * add connections between the function blocks to the diagram. These are called networks; |
| − | * | + | * add and edit names of networks on the diagram; |
| − | * | + | * merge, split and change the configuration of networks; |
| − | * | + | * change the numbering of function blocks; |
| − | * | + | * assign input data sources and output data recipients of function blocks by using constants and controller resource registers. |
| − | + | The editor has a stepwise undo command for the last action performed by the user - ''Undo'', which is performed by selecting ''«Edit» → «Undo»'' in the main menu or by pressing the shortcut combination ''«Ctrl+Z»'', as well as a command to redo the last undone action - ''Redo'', which is performed by selecting ''«Edit» → «Redo»'' in the main menu or by pressing the shortcut combination ''«Ctrl+Y»''. | |
| − | + | The user can use the clipboard for cutting, copying and pasting fragments of the diagram. The clipboard persists when opening a new file, which allows the user to paste between different files. Access the commands ''«Cut»'', ''«Copy»'' and ''«Paste»'' via the menu ''«Edit»'' or, like in other apps, use familiar keyboard shortcuts ''«Ctrl+X»'', ''«Ctrl+C»'' and ''«Ctrl+V»'' accordingly. | |
| − | + | The user can vertically scroll the workspace by using the mouse wheel, pressing cursor keys ↑ ↓, pressing ''PageUp'' and ''PageDown'' keys or the vertical scroll bar, horizontal scrolling is done by pressing the cursor keys ← →, holding down ''«Alt»'' and using the mouse wheel or by using the horizontal scrollbar. | |
| − | + | To quickly change workspace display scaling, use the mouse wheel while holding down ''«Ctrl»''. | |
| − | + | To quickly move around the workspace area the user can use the ''«Drag-and-Drop»'' method by holding down the mouse wheel and moving the editor's workspace with the mouse. The mouse pointer will change from an arrow to a grasping hand. | |
| + | === Adding function blocks to the diagram === | ||
| − | + | Adding a new function block to the diagram creates a new instance of the function block type that you selected. You can add a new function block in one of two ways: | |
| − | + | * highlight a function block in the function block panel by clicking the left mouse button, then right click within the workspace and select the “Add Block” function in the context menu; | |
| − | + | [[File:4_6_1_1.png]]; | |
| − | * | + | * hold down the left mouse button on a function block in the function block panel, drag it into the workspace then release the left mouse button. A preview of the block you are dragging will be shown under your mouse cursor. |
| − | + | For example: | |
{| | {| | ||
|[[File:4_6_1_2.png|4_6_1_2.png]] | |[[File:4_6_1_2.png|4_6_1_2.png]] | ||
| | | | ||
| − | |valign="top" style="padding-top:10px;"| - | + | |valign="top" style="padding-top:10px;"| - how the cursor appears while adding a "Logical AND" block: |
|} | |} | ||
| − | === | + | === Selecting elements of the function diagram === |
| − | + | Select any object on the diagram by clicking on it. When selected, the function blocks will change their background colour to yellow, while other elements will have their border highlighted in the “Selected Network Colour”, which is blue by default. | |
| − | + | Select multiple objects on the diagram by drawing a frame around them - click the left mouse button on a free spot in the workspace and drag the mouse without releasing the left button, until all the necessary elements are selected. An element will be selected even if it’s only partially captured by the selection frame. | |
| − | + | ||
| − | + | ||
| − | + | ||
[[File:4_6_3_1.png]] | [[File:4_6_3_1.png]] | ||
| − | + | Selecting multiple objects can also be done by clicking several objects while holding down the ''«Ctrl»'' key. Press the left mouse button on an already selected element by holding down the ''«Ctrl»'' key to remove it from your current selection. This can be done regardless of the selection method used to select the element. | |
| − | + | Clear your selection by clicking the left mouse button on an area of diagram workspace free from elements. | |
| + | === Moving function blocks === | ||
| − | + | You can move function blocks around the diagram by dragging them, similarly to how you would drag them from the function block area. Select a block within the workspace(when you select the background colour of the block turns yellow), hold down the mouse button over it, then then drag and drop it wherever you want by moving the mouse and releasing the left mouse button. You can relocate multiple selected elements this way. As long as you are holding down the mouse button over one of the selected elements, all elements in the selection will be moved along with it. | |
| − | + | === Deleting function diagram elements === | |
| + | Remove function blocks or diagram networks by selecting an object or group of objects to be deleted, then pressing the ''«Delete»'' key on the keyboard. Alternatively, you can right click on an element(which will select if it it isn’t already selected) and choose ''«Delete»'' in the context menu. | ||
| − | === | + | === Creating a connection line === |
| − | + | You can create a new connection line on the function diagram: | |
| − | * | + | * from the output of a function block to the input of either the same block or another function block; |
| − | * | + | * from the input of a function block to the output of either the same block or another function block; |
| − | * | + | * from the input or output of a the function block to an already existing connection line; |
| − | * | + | * from the output of a constant or a write register to a function block input, a function block output or an existing connection line. |
| − | + | All valid input and output connection points are marked on the diagram by small green squares present next to each element. In addition, you can make an “unconnected” line by starting to create of a line and then double-clicking any spot within the workspace that’s free of diagram elements. | |
| − | + | To begin creating a connection line, position your mouse pointer wherever you want to start the connection line, then click the left mouse button. | |
[[File:4_6_5_1.png]] | [[File:4_6_5_1.png]] | ||
| − | + | When you start moving the mouse cursor a connection line will begin to form. It will turn automatically, depending on your cursor position. | |
[[File:4_6_5_2.png]] | [[File:4_6_5_2.png]] | ||
| − | + | Add a line node (kink point) by clicking the left mouse button anywhere on the diagram that isn’t a connection point. Line nodes don’t move when you move elements they are connected to. | |
| + | |||
| + | Finish creating the line by clicking the left mouse button on a valid connection point. | ||
[[File:4_6_5_3.png]] | [[File:4_6_5_3.png]] | ||
| Line 84: | Line 86: | ||
[[File:4_6_5_4.png]] | [[File:4_6_5_4.png]] | ||
| − | + | Break the line at an arbitrary point on the diagram by double clicking the left mouse button anywhere that isn’t a valid connection point. If you want to cancel the creation process altogether press the ''Esc'' key. | |
| − | + | An unconnected line ends with a smart arrow that points one way or another depending on the position of the line on the plane and whether the line is a source or receiver of data. This also applies to named networks. | |
[[File:4_6_5_5.png]] | [[File:4_6_5_5.png]] | ||
| − | === | + | === Modifying connection line === |
| − | + | Modify the position and shape of the connecting line by dragging its straight sections. | |
| − | + | Move the mouse pointer over to the area requiring changes, hold down the left mouse button, move the pointer to a new location, then let go of the left mouse button. | |
[[File:4_6_6_1.png]] | [[File:4_6_6_1.png]] | ||
| − | + | It is possible to finish unconnected lines - continue their creation from the final node. | |
[[File:4_6_6_4.png]] | [[File:4_6_6_4.png]] | ||
| − | + | For line branching, click on the desired line node and continue creating the line from that point as usual. | |
[[File:4_6_6_5.png]] | [[File:4_6_6_5.png]] | ||
| + | === Segments and networks of connecting lines === | ||
| − | + | When implementing an algorithm as a function diagram, the usual practice is to link the output of one function block with multiple function blocks inputs, including their own inputs, forming branching connection lines on the diagram. We will refer to an unbroken connection line from one function block to another as a network segment. Network segments can have any number of branches(or none at all), the important part is the connection line being unbroken. This definition will be important later on. The illustration below shows two segments. | |
| − | + | ||
| − | + | ||
{| | {| | ||
| − | |valign="top" style="padding-left:0.5em;"|'' | + | |valign="top" style="padding-left:0.5em;"|''Note:'' |
| − | |valign="top" style="padding-left:0.5em;"|'' | + | |valign="top" style="padding-left:0.5em;"|''In accordance with the agreement adopted in the CFD language, any output of a function block can be connected to multiple inputs within a single network, whether these inputs belong to other blocks, or itself. But no input of a function block can be connected to multiple outputs. Despite the fact that the diagram editor allows you to make such a connection, when you try to save, upload the diagram to the controller or run the diagram in the simulator, CannyLab will display an error message.'' |
|} | |} | ||
[[File:4_6_7_1.png]] | [[File:4_6_7_1.png]] | ||
| − | + | Click the left mouse button on a connection line belonging to any segment to highlight the entire segment. | |
[[File:4_6_7_2.png]] | [[File:4_6_7_2.png]] | ||
| − | + | You can remove a segment the same way you would remove any other element of the function diagram. | |
| + | === Named networks === | ||
| − | + | For convenience of working with large functional diagrams, the editor allows the user to create named networks. You can assign a name to any segment. Segments that aren’t connected visually, but have the same name will be logically connected “logically”: they work as if they were connected visually and represented a single segment. We will refer to such connection as a network. A network consists of one or more segments. | |
| − | + | [[File:4_6_8_1.png]] | |
| − | + | The use of named networks can reduce the total length and number of intersecting connection lines on the diagram as well as visually isolate groups of blocks related to one function. This increases the readability of the diagram. | |
| − | + | Assign a network's name by double-clicking the left mouse button when pointing at a network to be named. Alternatively you can right click and select "Rename" from the context menu. | |
| − | + | ||
| − | + | ||
{| | {| | ||
| − | |- style="padding:0px;line-height: | + | |- style="padding:0px;line-height:1.7;" |
|rowspan="6"|[[File:4_6_8_2.png]] | |rowspan="6"|[[File:4_6_8_2.png]] | ||
| − | | ''- | + | |
| − | + | | ''- break the segment, removing the section between the closest nodes;'' | |
| − | + | ||
| − | + | ||
| − | + | ||
| − | + | ||
| − | + | ||
| − | + | ||
| − | + | ||
|- style="padding:0px;line-height:0.8;" | |- style="padding:0px;line-height:0.8;" | ||
| − | | ''- | + | | ''- set a new name for this network;'' |
| + | |- style="padding:0px;line-height:2.0;" | ||
| + | | ''- cut the selected segment(s);'' | ||
| + | |- style="padding:0px;line-height:1;" | ||
| + | | ''- copy the selected segment(s);'' | ||
| + | |- style="padding:0px;line-height:1;" | ||
| + | | ''- paste the copied or cut segment(s);'' | ||
| + | |- style="padding:0px;line-height:1;" | ||
| + | | ''- delete the selected segment(s).'' | ||
|} | |} | ||
| − | + | After specifying the network name a new item called '' 'Show Net Name' '' will appear in the context menu. When selected, it creates an additional label with the network’s name on the diagram. If the network name is used in several places on the diagram, then the context menu additionally contains items ''«Rename entire network»'' and ''«Select entire network»''. | |
[[File:4_6_8_3.png]] | [[File:4_6_8_3.png]] | ||
[[File:4_6_8_4.png]] | [[File:4_6_8_4.png]] | ||
| − | + | Naming the network is performed via a dialog box. You can either enter a new name for the network segment into the text field or select one that has been defined previously from the dropdown menu. Renaming an entire network works identically. | |
[[File:4_6_8_5.png]] | [[File:4_6_8_5.png]] | ||
| + | === Function block identification numbers === | ||
| − | + | Function blocks have unique identification numbers, which are assigned to the block when it is added to the diagram. The new block is assigned the first available number in the range of numbers from one to the maximum number present on the block diagram plus one. | |
| − | + | The identification number of the block is stored in the diagram file and remains unchanged on subsequent calls to the file. | |
| − | + | To re-order block numbers at any time, use the option ''«Tools »→« Renumber blocks»'' in the main menu. When used, the blocks will be renumbered in order of their execution according to the current state of the diagram. | |
| − | + | === Constants === | |
| + | Numerical constants can be used as inputs for function blocks. Adding a new constant to the diagram can be accomplished in one of two ways: | ||
| + | * right click in the workspace and select Add Constant from the context menu | ||
| + | :: [[File:4_6_10_10.png]]; | ||
| + | * drag and drop the constant from the function block panel as you would any other block. A preview of the constant will be visible under your mouse cursor. [[File:4_6_10_11.png]]. | ||
| − | + | Alternatively, a constant can be added directly to an '''empty''' input of any function block. Right click the specific input you want to add the constant to and select “Place Constant” from the context menu. | |
| − | + | ||
| − | + | ||
[[File:4_6_10_1.png]] | [[File:4_6_10_1.png]] | ||
| − | + | Following this a constant will be added directly to the input. By default, the value of the newly added constant is zero. Constants added in this fashion will be dragged along with the function block whenever you move it around. | |
[[File:4_6_10_2.png]] | [[File:4_6_10_2.png]] | ||
| − | + | Change the value of a constant by either double clicking it or right clicking it and selecting “Enter Value” from the context menu. | |
[[File:4_6_10_3.png]] | [[File:4_6_10_3.png]] | ||
| − | + | This will open a dialog window. The entered values can be in decimal, hexadecimal, binary, or symbolic form. The value will be displayed on the diagram in the selected format. | |
[[File:4_6_10_4.png]] [[File:4_6_10_5.png]] | [[File:4_6_10_4.png]] [[File:4_6_10_5.png]] | ||
| Line 190: | Line 194: | ||
[[File:4_6_10_6.png]] [[File:4_6_10_7.png]] | [[File:4_6_10_6.png]] [[File:4_6_10_7.png]] | ||
| − | + | Decimal value can be set as 1 to 5 digit number in a range between 0 and 65535; hexadecimal as a 1 to 4 digit number in a range between 0 and FFFF (hex symbols can be entered as upper or lower case); binary as a 1 to 16 digit number ranging from 0 to 1111111111111111; as symbol it can be any symbol of the main ASCII table. | |
{| | {| | ||
| − | |valign="top" style="padding-left:0.5em;"|'' | + | |valign="top" style="padding-left:0.5em;"|''Note:'' |
| − | |valign="top" style="padding-left:0.5em;"|'' | + | |valign="top" style="padding-left:0.5em;"|''When entering the character values you are allowed to use special characters in the following format: «\n» - ASCII character code 0x0A (newline), «\r» - ASCII character code 0x0D (carriage return), «\t» - ASCII character code 0x09 (horizontal tab), «\0» - ASCII character code 0x00 (null), «\xYY» any character, where YY – is a character’s ASCII code in hexadecimal format.'' |
|} | |} | ||
| − | + | When the user changes the constant display format, the current value will be automatically converted into the selected numbering system. | |
| − | + | For configuration and operation of controller resources, it is necessary to use special named constants. You can access these constants by right clicking the constant and choosing “Select from List” in the context menu, or double-clicking the constant while holding down “Ctrl”. Select the named constant in the new window. | |
| − | + | Named constants are presented in tree view and grouped by purpose. | |
[[File:4_6_10_8.png]] | [[File:4_6_10_8.png]] | ||
| − | + | When choosing a named constant as the block input value, the constant’s abbreviated name will be displayed instead of its value on the diagram. | |
[[File:4_6_10_9.png]] | [[File:4_6_10_9.png]] | ||
| − | |||
| − | |||
{| | {| | ||
| − | |valign="top" style="padding-left:0.5em;"|'' | + | |valign="top" style="padding-left:0.5em;"|''Note:'' |
| − | |valign="top" style="padding-left:0.5em;"|'' | + | |valign="top" style="padding-left:0.5em;"|''Despite the fact that each of the named constants has a definite numerical value, the use of named constants outside of configuring and using the associated controller resources is not desirable, as it makes it difficult to read and understand the diagram.'' |
|} | |} | ||
| + | === Registers === | ||
| − | + | Access to controller hardware resources from the function diagram is done by referencing specific registers (addresses) in memory of the controller. These registers contain data detailing the status of the controller’s resources and receive data used to control these resources. Registers are divided into read-only or write-only. | |
| − | + | Add a new read or write register on the diagram in the following ways: | |
| − | + | * right click the workspace and select “Place Input Register” or “Place Output Register” from the context menu | |
| + | :: [[File:4_6_11_6.png]]; | ||
| + | * drag and drop the read or write register from the function block panel. A preview of the register you are adding will be shown under your mouse cursor. | ||
| − | + | For example, adding a read register: [[File:4_6_11_7.png]] | |
| + | |||
| + | In addition, the register can be added directly to an '''empty''' input or output of any function block. Right click the input or output and select the appropriate option in the context menu. | ||
| + | |||
| + | :: [[File:4_6_11_8.png]] | ||
| + | |||
| + | After selecting the register as a data source or data receiver (or double-clicking the register that you placed in the workspace manually), a dialog box opens, listing all registers available for selection, grouped by functionality. | ||
| + | |||
| + | Unlike constants, registers can’t be entered manually, only selected from a list. | ||
[[File:4_6_11_3.png]] | [[File:4_6_11_3.png]] | ||
| − | + | After you choose a register, its abbreviated name will be displayed on the diagram. | |
[[File:4_6_11_4.png]] | [[File:4_6_11_4.png]] | ||
| − | |||
| − | |||
[[File:4_6_11_5.png]] | [[File:4_6_11_5.png]] | ||
| − | |||
| − | |||
{| | {| | ||
| − | |valign="top" style="padding-left:0.5em;"|'' | + | |valign="top" style="padding-left:0.5em;"|''Note:'' |
| − | |valign="top" style="padding-left:0.5em;"|'' | + | |valign="top" style="padding-left:0.5em;"|''According to the CFD language agreement, using the same write register multiple times within the same diagram is not allowed. Despite the fact that the editor allows the user to create duplicate write registers on the diagram, when you try to save, upload the diagram to the controller or run the diagram in the simulator, CannyLab will display an error message.'' |
|} | |} | ||
| − | + | Registers are divided into read and write registers, according to their access method. The read register can be used as a source of data for other diagram elements, while the write register can be used as a data receiver. | |
Latest revision as of 15:25, 11 December 2020
The main operating mode of CannyLab is the function diagram editor.
Contents
- 1 General description
- 2 Adding function blocks to the diagram
- 3 Selecting elements of the function diagram
- 4 Moving function blocks
- 5 Deleting function diagram elements
- 6 Creating a connection line
- 7 Modifying connection line
- 8 Segments and networks of connecting lines
- 9 Named networks
- 10 Function block identification numbers
- 11 Constants
- 12 Registers
General description
The function diagram editor is the main method of working within CannyLab. In function diagram editor mode, the user can:
- Add function blocks to the diagram;
- move function blocks within the diagram;
- select and delete diagram elements;
- add connections between the function blocks to the diagram. These are called networks;
- add and edit names of networks on the diagram;
- merge, split and change the configuration of networks;
- change the numbering of function blocks;
- assign input data sources and output data recipients of function blocks by using constants and controller resource registers.
The editor has a stepwise undo command for the last action performed by the user - Undo, which is performed by selecting «Edit» → «Undo» in the main menu or by pressing the shortcut combination «Ctrl+Z», as well as a command to redo the last undone action - Redo, which is performed by selecting «Edit» → «Redo» in the main menu or by pressing the shortcut combination «Ctrl+Y».
The user can use the clipboard for cutting, copying and pasting fragments of the diagram. The clipboard persists when opening a new file, which allows the user to paste between different files. Access the commands «Cut», «Copy» and «Paste» via the menu «Edit» or, like in other apps, use familiar keyboard shortcuts «Ctrl+X», «Ctrl+C» and «Ctrl+V» accordingly.
The user can vertically scroll the workspace by using the mouse wheel, pressing cursor keys ↑ ↓, pressing PageUp and PageDown keys or the vertical scroll bar, horizontal scrolling is done by pressing the cursor keys ← →, holding down «Alt» and using the mouse wheel or by using the horizontal scrollbar.
To quickly change workspace display scaling, use the mouse wheel while holding down «Ctrl».
To quickly move around the workspace area the user can use the «Drag-and-Drop» method by holding down the mouse wheel and moving the editor's workspace with the mouse. The mouse pointer will change from an arrow to a grasping hand.
Adding function blocks to the diagram
Adding a new function block to the diagram creates a new instance of the function block type that you selected. You can add a new function block in one of two ways:
- highlight a function block in the function block panel by clicking the left mouse button, then right click within the workspace and select the “Add Block” function in the context menu;
 ;
;
- hold down the left mouse button on a function block in the function block panel, drag it into the workspace then release the left mouse button. A preview of the block you are dragging will be shown under your mouse cursor.
For example:
| - how the cursor appears while adding a "Logical AND" block: |
Selecting elements of the function diagram
Select any object on the diagram by clicking on it. When selected, the function blocks will change their background colour to yellow, while other elements will have their border highlighted in the “Selected Network Colour”, which is blue by default.
Select multiple objects on the diagram by drawing a frame around them - click the left mouse button on a free spot in the workspace and drag the mouse without releasing the left button, until all the necessary elements are selected. An element will be selected even if it’s only partially captured by the selection frame.

Selecting multiple objects can also be done by clicking several objects while holding down the «Ctrl» key. Press the left mouse button on an already selected element by holding down the «Ctrl» key to remove it from your current selection. This can be done regardless of the selection method used to select the element.
Clear your selection by clicking the left mouse button on an area of diagram workspace free from elements.
Moving function blocks
You can move function blocks around the diagram by dragging them, similarly to how you would drag them from the function block area. Select a block within the workspace(when you select the background colour of the block turns yellow), hold down the mouse button over it, then then drag and drop it wherever you want by moving the mouse and releasing the left mouse button. You can relocate multiple selected elements this way. As long as you are holding down the mouse button over one of the selected elements, all elements in the selection will be moved along with it.
Deleting function diagram elements
Remove function blocks or diagram networks by selecting an object or group of objects to be deleted, then pressing the «Delete» key on the keyboard. Alternatively, you can right click on an element(which will select if it it isn’t already selected) and choose «Delete» in the context menu.
Creating a connection line
You can create a new connection line on the function diagram:
- from the output of a function block to the input of either the same block or another function block;
- from the input of a function block to the output of either the same block or another function block;
- from the input or output of a the function block to an already existing connection line;
- from the output of a constant or a write register to a function block input, a function block output or an existing connection line.
All valid input and output connection points are marked on the diagram by small green squares present next to each element. In addition, you can make an “unconnected” line by starting to create of a line and then double-clicking any spot within the workspace that’s free of diagram elements.
To begin creating a connection line, position your mouse pointer wherever you want to start the connection line, then click the left mouse button.

When you start moving the mouse cursor a connection line will begin to form. It will turn automatically, depending on your cursor position.

Add a line node (kink point) by clicking the left mouse button anywhere on the diagram that isn’t a connection point. Line nodes don’t move when you move elements they are connected to.
Finish creating the line by clicking the left mouse button on a valid connection point.


Break the line at an arbitrary point on the diagram by double clicking the left mouse button anywhere that isn’t a valid connection point. If you want to cancel the creation process altogether press the Esc key.
An unconnected line ends with a smart arrow that points one way or another depending on the position of the line on the plane and whether the line is a source or receiver of data. This also applies to named networks.

Modifying connection line
Modify the position and shape of the connecting line by dragging its straight sections.
Move the mouse pointer over to the area requiring changes, hold down the left mouse button, move the pointer to a new location, then let go of the left mouse button.

It is possible to finish unconnected lines - continue their creation from the final node.

For line branching, click on the desired line node and continue creating the line from that point as usual.

Segments and networks of connecting lines
When implementing an algorithm as a function diagram, the usual practice is to link the output of one function block with multiple function blocks inputs, including their own inputs, forming branching connection lines on the diagram. We will refer to an unbroken connection line from one function block to another as a network segment. Network segments can have any number of branches(or none at all), the important part is the connection line being unbroken. This definition will be important later on. The illustration below shows two segments.
| Note: | In accordance with the agreement adopted in the CFD language, any output of a function block can be connected to multiple inputs within a single network, whether these inputs belong to other blocks, or itself. But no input of a function block can be connected to multiple outputs. Despite the fact that the diagram editor allows you to make such a connection, when you try to save, upload the diagram to the controller or run the diagram in the simulator, CannyLab will display an error message. |

Click the left mouse button on a connection line belonging to any segment to highlight the entire segment.

You can remove a segment the same way you would remove any other element of the function diagram.
Named networks
For convenience of working with large functional diagrams, the editor allows the user to create named networks. You can assign a name to any segment. Segments that aren’t connected visually, but have the same name will be logically connected “logically”: they work as if they were connected visually and represented a single segment. We will refer to such connection as a network. A network consists of one or more segments.

The use of named networks can reduce the total length and number of intersecting connection lines on the diagram as well as visually isolate groups of blocks related to one function. This increases the readability of the diagram.
Assign a network's name by double-clicking the left mouse button when pointing at a network to be named. Alternatively you can right click and select "Rename" from the context menu.

|
- break the segment, removing the section between the closest nodes; |
| - set a new name for this network; | |
| - cut the selected segment(s); | |
| - copy the selected segment(s); | |
| - paste the copied or cut segment(s); | |
| - delete the selected segment(s). |
After specifying the network name a new item called 'Show Net Name' will appear in the context menu. When selected, it creates an additional label with the network’s name on the diagram. If the network name is used in several places on the diagram, then the context menu additionally contains items «Rename entire network» and «Select entire network».


Naming the network is performed via a dialog box. You can either enter a new name for the network segment into the text field or select one that has been defined previously from the dropdown menu. Renaming an entire network works identically.

Function block identification numbers
Function blocks have unique identification numbers, which are assigned to the block when it is added to the diagram. The new block is assigned the first available number in the range of numbers from one to the maximum number present on the block diagram plus one.
The identification number of the block is stored in the diagram file and remains unchanged on subsequent calls to the file.
To re-order block numbers at any time, use the option «Tools »→« Renumber blocks» in the main menu. When used, the blocks will be renumbered in order of their execution according to the current state of the diagram.
Constants
Numerical constants can be used as inputs for function blocks. Adding a new constant to the diagram can be accomplished in one of two ways:
- right click in the workspace and select Add Constant from the context menu
-
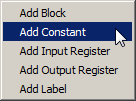 ;
;
-

- drag and drop the constant from the function block panel as you would any other block. A preview of the constant will be visible under your mouse cursor.
 .
.
Alternatively, a constant can be added directly to an empty input of any function block. Right click the specific input you want to add the constant to and select “Place Constant” from the context menu.

Following this a constant will be added directly to the input. By default, the value of the newly added constant is zero. Constants added in this fashion will be dragged along with the function block whenever you move it around.

Change the value of a constant by either double clicking it or right clicking it and selecting “Enter Value” from the context menu.

This will open a dialog window. The entered values can be in decimal, hexadecimal, binary, or symbolic form. The value will be displayed on the diagram in the selected format.


Decimal value can be set as 1 to 5 digit number in a range between 0 and 65535; hexadecimal as a 1 to 4 digit number in a range between 0 and FFFF (hex symbols can be entered as upper or lower case); binary as a 1 to 16 digit number ranging from 0 to 1111111111111111; as symbol it can be any symbol of the main ASCII table.
| Note: | When entering the character values you are allowed to use special characters in the following format: «\n» - ASCII character code 0x0A (newline), «\r» - ASCII character code 0x0D (carriage return), «\t» - ASCII character code 0x09 (horizontal tab), «\0» - ASCII character code 0x00 (null), «\xYY» any character, where YY – is a character’s ASCII code in hexadecimal format. |
When the user changes the constant display format, the current value will be automatically converted into the selected numbering system.
For configuration and operation of controller resources, it is necessary to use special named constants. You can access these constants by right clicking the constant and choosing “Select from List” in the context menu, or double-clicking the constant while holding down “Ctrl”. Select the named constant in the new window.
Named constants are presented in tree view and grouped by purpose.

When choosing a named constant as the block input value, the constant’s abbreviated name will be displayed instead of its value on the diagram.
![]()
| Note: | Despite the fact that each of the named constants has a definite numerical value, the use of named constants outside of configuring and using the associated controller resources is not desirable, as it makes it difficult to read and understand the diagram. |
Registers
Access to controller hardware resources from the function diagram is done by referencing specific registers (addresses) in memory of the controller. These registers contain data detailing the status of the controller’s resources and receive data used to control these resources. Registers are divided into read-only or write-only.
Add a new read or write register on the diagram in the following ways:
- right click the workspace and select “Place Input Register” or “Place Output Register” from the context menu
-
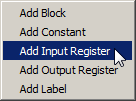 ;
;
-

- drag and drop the read or write register from the function block panel. A preview of the register you are adding will be shown under your mouse cursor.
For example, adding a read register: ![]()
In addition, the register can be added directly to an empty input or output of any function block. Right click the input or output and select the appropriate option in the context menu.

After selecting the register as a data source or data receiver (or double-clicking the register that you placed in the workspace manually), a dialog box opens, listing all registers available for selection, grouped by functionality.
Unlike constants, registers can’t be entered manually, only selected from a list.

After you choose a register, its abbreviated name will be displayed on the diagram.
![]()

| Note: | According to the CFD language agreement, using the same write register multiple times within the same diagram is not allowed. Despite the fact that the editor allows the user to create duplicate write registers on the diagram, when you try to save, upload the diagram to the controller or run the diagram in the simulator, CannyLab will display an error message. |
Registers are divided into read and write registers, according to their access method. The read register can be used as a source of data for other diagram elements, while the write register can be used as a data receiver.