| This documentation is out of date.
The new version of the documentation is here: https://cannylogic.com/docs |
CANNY CAN/LIN monitor

| Heads up! | 'This is a WIP translation of a newer version of Russian documentation on Canny monitor v2. It, along with other articles, will soon be available on our new English documentation website. The images in this document are from an outdated version of Canny Monitor. |
Canny CAN/LIN Monitor (ccm.exe) is a standalone utility included in the IDE CannyLab. Using CANNY 7 controller as an interface converter, it allows the user to receive CAN and LIN data, visually analyze it on their PC monitor, copy said data to the clipboard for further processing. While working with CAN it also enables the user to transmit data, LIN can only be received.
Contents
- 1 Preparing CANNY 7 for use as a CAN(LIN) monitor
- 2 Connecting to the CAN bus
- 3 Connecting to the LIN bus
- 4 Additional operating mode parameters in Canny CAN/LIN Monitor
- 5 LIN Monitor Auto-baud mode
- 6 Hotkeys
- 7 Canny CAN/LIN Main Window
- 8 Canny CAN/LIN Main Menu
- 9 File sub-menu
- 10 Edit sub-menu
- 11 View sub-menu
- 12 Capture sub-menu
- 13 Canny CAN/LIN Toolbar
- 14 Canny CAN/LIN Control Panel
- 15 Control Panel line display format
- 16 Changing data display format in the Control Panel
- 17 Canny Monitor Log
- 18 Log display format
- 19 Saving Log entries
- 20 Command Line
- 21 Command Line message format
- 22 Quick repeat/edit a previously sent command
- 23 Status bar
- 24 Canny Monitor context menus
Preparing CANNY 7 for use as a CAN(LIN) monitor
To use CANNY 7 as a CAN(LIN)-to-USB interface converter, you need to first upload specialized firmware to the controller, using the automatic controller software upload utility that ships with the IDE CannyLab.
The utility is located in a subfolder of the CannyLab install directory:
- CANNY 7: \ccx\canny7\c7canmon_vXXX.exe
- CANNY 7.2 duo:\ccx\canny72duo\c72duocanmon_v208
- etc.
where XXX is the up-to-date version of specialized firmware.
| Note: | LIN monitoring functionality is available starting with version 1.55 of the specialized firmware (c7canmon_v155.exe) and version 1.16 of CANNY CAN(LIN) monitor |
Preparing the CANNY 7 controller for working with Canny Monitor.
Note: Canny 7.2 duo and Canny 5.3 pico can be prepared in the exact same way.
- Launch c7canmon_vXXX.exe;
- Carefully read the information in the “Comment” panel to the left, use the scroll bar if necessary.
- Open CANNY7’s housing and connect the controller to the PC using a USB-to-miniUSB cable. If necessary wait for your OS to install the required drivers. ;
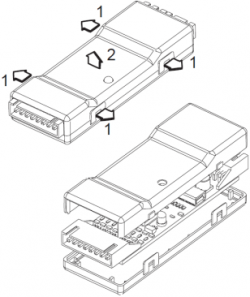
. 


- If the connection was successful, your CANNY 7 controller’s serial number, vendor identifier and information about the presence of installed firmware will appear in the status bar. The “Write” button will become available.
- File:11 15.png;
- Press the "Write" button and wait until the firmware is successfully uploaded into the controller;
- Disconnect the controller from your PC.
After successfully preparing CANNY7 for use as a CAN(LIN) monitor, you will need to properly connect it to the data bus you will be working with.
| Attention! | 'In order for CANNY CAN(LIN) monitor to properly work with LIN, the GND terminals of LIN devices, CANNY7 and the PC all need to be securely connected with each other. |
Connecting to the CAN bus
The initial state: the controller is disconnected from the PC, power and the data bus(the 4 pin connector is not connected).
- Connect the wires for the 4-pin connector: red wire - +12V, black wire - GND, gray wire - CAN-H, blue wire - CAN-L;

- Connect the 4-pin connector to the controller. The two-color embedded controller LED will start quickly cycling colors;
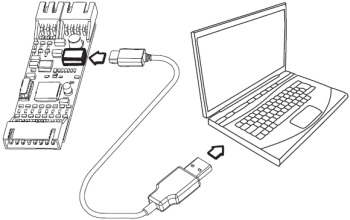
- Connect the controller to the PC, using a USB-to-miniUSB wire (not shipped with the controller);
- Launch CannyLab and choose CAN/LIN monitor in the main menu or launch ccm.exe directly from the root folder of the CannyLab IDE installation;
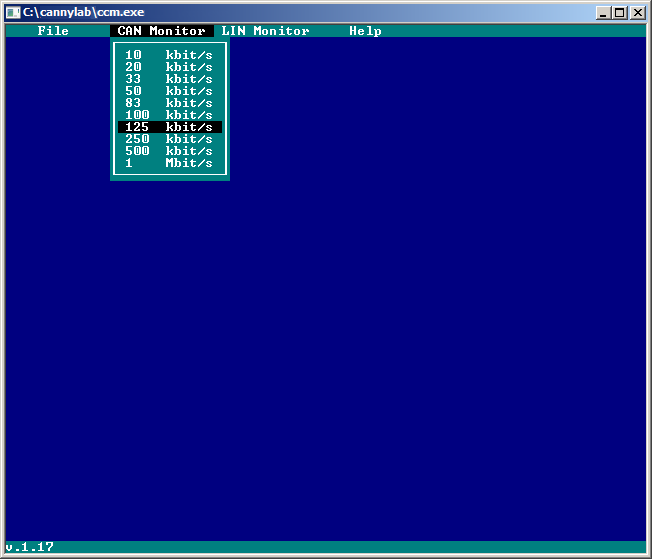
- Press the Options button (Gear image goes here) in Canny CAN/Lin monitor. Select CAN as the mode of operation, then select the expected data transfer rate of the CAN data bus you are working with from the available options in the drop-down list.
Note: The specific LED blinking patterns of CANNY 5.3 pico and CANNY 7.2 duo may differ from CANNY 7.
 ;
;

If the device was connected correctly, the status bar in CANNY CAN(LIN) monitor will display a message reporting a successful connection or information about the CAN bus connection.
![]()
![]()
If the CAN bus is active, the control panel will contain CAN data, grouped by message identifiers. The log displays received messages in chronological order.

If connection between CANNY7 and CANNY CAN(LIN) monitor is interrupted or cannot be established, a warning message will appear.
![]()
Connecting to the LIN bus
Note: Canny 7.2 duo and Canny 5.3 pico can be prepared in the exact same way.
The initial state: the controller is disconnected from the PC, power and the data bus(the 4 pin connector is not connected).
- Connect the wires for the 4-pin connector: red wire - +12V, black wire - GND, gray and blue wires should remain unconnected;
- Connect the wires for the 3-pin connector: white wire – LIN bus, green and brown wires should remain unconnected.
Important note: The wire color arrangement for connecting the LIN monitor to CANNY 5.3 pico is identical to that of CANNY7. For CANNY 7.2 duo, the wire colors are identical, but the LIN bus is connected to the green wire/first terminal of the X3 contact, rather than the white wire/second terminal.

- Connect the 4-pin connector to the controller. The embedded two-color LED will start cycling colors;
- Connect the 3-pin connector to the controller;
- Connect the controller to the PC, using a USB-to-miniUSB cable;
- Launch ccm.exe from the root folder of the CannyLab IDE installation ;
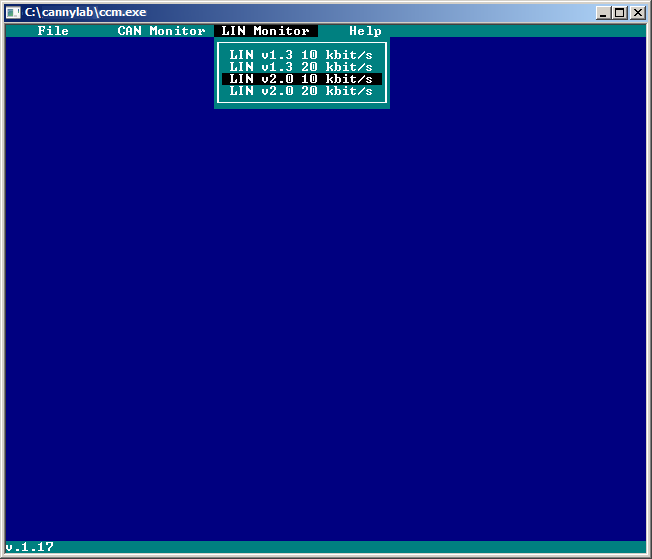
- Open settings by clicking the gear icon. Select LIN as the operating mode. Select the expected data transfer rate of the LIN data bus you are working with from the available options in the drop-down list.
Note: The specific LED blinking patterns of CANNY 5.3 pico and CANNY 7.2 duo may differ from CANNY 7.
 ;
;

If the device was connected correctly, the status bar in CANNY CAN(LIN) monitor will display a message reporting a successful connection.
![]()
If the CAN bus is active, the control panel will contain LIN data, grouped by message identifiers. The log displays received messages in chronological order.

| Attention! | Canny Monitor shows the value of the 6-bit ID message identifier, NOT the 8-bit PID that contains automatically calculated checksum bits alongside the identifier. PID is frequently confused for ID. |
| Attention! | While working with the LIN bus CANNY CAN(LIN) monitor functions as a SLAVE-node for the bus. Automatic transfer rate selection is implemented in the application. If CANNY CAN(LIN) monitor is configured for 10 kbit/s, it will still properly receive higher(20 kbit/s) rate transmissions. However, if the monitor is configured for 20 kbit/s, receiving data at a slower rate is impossible. |
If connection between CANNY7 and CANNY CAN(LIN) monitor is interrupted or cannot be established, a warning message will appear.
![]()
Additional operating mode parameters in Canny CAN/LIN Monitor
The user can set the CAN bus to a “Read only”/Listen Only mode, in which the controller doesn’t send an acknowledgement (ACK) back to the CAN network when it successfully receives files. This makes the controller an entirely passive device that is fully invisible to the CAN network and cannot affect anything.
Note: Transmitting data via the Canny CAN/LIN Monitor command line is impossible when Listen Only mode is active.
Image17 goes here
LIN Monitor Auto-baud mode
Auto-baud mode lets Canny Monitor automatically control data receive rate. When Auto-baud mode is activated Canny Monitor can receive data at rates that differ from one the user has set in the settings, within certain limits. When deactivated, Canny Monitor can only receive data from the LIN bus if the settings speed and LIN bus speed match. This mode is activated by default.
Image18 goes here
Hotkeys
Up: Move the cursor/Scroll active panel up; show an older Command Line message.
Down: Move the cursor/Scroll active panel down; show a newer Command Line message.
Tab: Changes the active panel of the window in the following cyclic order: Control Panel → Log → Command line → Send Data button → Control Panel.
Delete: Excludes the selected message identifiers from being logged. Deactivates the selected filters in Control Panel, stops data with selected message identifiers from being logged in the Log.
Space: Inverts the activation status of message filters on the Control Panel for all selected identifiers.
Pause: Temporarily stops displaying incoming data on the Control Panel and logging it in the Log. Resume both by pressing Pause again. Does not impact the connection.
CTRL+A: Selects all contents of the active panel.
CTRL+C/CTRL+INS: Copies selected Log entries to the clipboard.
ESC: Stops the monitor from receiving data altogether and closes the connection.
Canny CAN/LIN Main Window
The following image shows the Main Window in CAN operating mode.
Image19
Canny CAN/LIN Main Menu
The topmost bar of the interface is the main menu. It consists of 4 sub-menus, which are used for configuring the utility.
The File sub-menu contains commands for saving the Log and exiting the application.
Image goes here
Save: Saves the log to a text file
Exit: Exits the program
The Edit sub-menu contains basic editing commands.
Copy: Copies the selected text fragment to the clipboard
Select All: Selects all contents of the active panel
The View sub-menu contains display options
Image goes here
Toolbar: Toggles Toolbar visibility
Panel: Toggles Control Panel visibility
Log: Toggles Log visibility
Command Line: Toggles Command Line visibility
Hold Highlights: Toggles the Hold Highlights mode
Reset Highlights: Resets the Hold Highlights mode
Reg: Toggles the usage of CannyLab register display mode for the Control Panel
Hex: Enables the display of data in base 16
Dec: Enables the display of data in base 10
Bin: Enables the display of data in binary. All three options are mutually exclusive
Zoom in: Increases font size in the Log and Control Panel
Zoom out: Decreases font size in the Log and Control Panel
Capture sub-menu lets the user control the message capture mode.
Image goes here
Options: Opens connection configuration settings.
Start: Attempts to connect to the controller and start receiving data
Pause: Pauses data transfer to the monitoring
Stop: Stops receiving data and terminates the connection
Navigation in the main menu can either be done with the arrow keys or your mouse. Select the necessary options by pressing ENTER or the left mouse button.
If the controller is connected to the data bus properly, the correct operation mode is selected and the bus is active, then the Control Panel and the Log will start displaying received data. The Log displays data in chronological order, while the Control Panel groups data by message identifiers and highlights the latest data byte changes in yellow.
Pause and resume the display of incoming data by using the Pause button.
Data is displayed in the hexadecimal format by default. Statistical and service information is always displayed and set in the decimal format.
Incoming data display mode can be changed using the View Menu or buttons on the Toolbar. This does not change how ID is displayed (it will always be displayed as a hexadecimal number).
Sending data to the CAN bus using the Command Line can only be done in hexadecimal.
Canny CAN/LIN Toolbar
Canny CAN/LIN Monitor Control Panel contains buttons for quick access to key commands.
Image goes here
Canny CAN/LIN Control Panel
Control Panel is the main area of the application window. It displays up-to-date CAN data, grouped by message identifiers.
Control Panel is the active panel whenever the application is launched. Use the mouse or hotkeys to configure filters for incoming data. The line being edited will be highlighted.
Image goes here
All data values in the Control Panel are up-to-date and are equivalent to the latest values received via the CAN bus.
The latest data changes are highlighted in yellow.
Image
Use the Hold Highlight button in the menu or on the toolbar to hold all currently present highlights. This means that even if the data doesn’t change for a while, the highlights will not go away. You can reset the currently held highlights using the Reset Highlights button.
Image
Control Panel line display format
Image goes here.
[V] 182 00 FA 97 5F 40 03 .. .. ._..@… 3364 0.313
a b c d e f g
a. - message filter activation checkbox. If the checkbox is ticked, then the message filter for the selected data identifier is active, the messages are received by the Canny Monitor and logged in the Log. If the checkbox is inactive, the messages are not received.
b. - message identifier. Can be viewed in standard (11 bit) or expanded (29 bit) modes for CAN. For LIN it is always 6 bit.
c. - fields containing message data bytes
d. - filler in case the message is shorter than 8 byes.
e. - displays the incoming messages in ASCII format
f. - the number of all received messages with this identifier for the current session
g. - displays the interval between the last two messages with this identifier
Changing data display format in the Control Panel
Use the buttons or View sub-menu commands to switch between the various display modes for the Control Panel. Log always presents data in hexadecimal.
Image16
Image10
Image2
CannyLab Register display mode:
To aid in the creation of function diagrams, activate the special Reg display mode. This displays data in the control panel in the format of the corresponding CannyLab registers.
ImageReg
Font size:
Change the font size by using the Zoom in and Zoom out buttons.
ImageZoom1
ImageZoom2
CAN filters
By default no message filters are active, so all incoming messages are received by Canny Monitor and logged in the Log.
When logging entire CAN bus data streams, that have a large amount of data, at high transmission rates individual messages can be lost due to technical limitations.
To avoid data loss and study incoming messages in detail, it is thus recommended to use Control Panel filters, filtering only the messages you are currently working with from the data stream.
14 hardware CAN message filters are available to the user. This means that the user can filter from 1 to 14 message identifiers on a hardware level and only receive those messages and nothing else. If you use more identifiers, additional software filters are used. These are more susceptible to data loss. When hardware filters are used, the message next to the filter icon on the status bar reports HW. If software filters are used – SW, when no filters are in use – NO.
When filters are used, only messages that pass through the active filters are logged in the Log
Move between entries in the control panel using the arrow keys. Page Up and Page Down can be used for fast, per-page scrolling. You can use the mouse wheel or Control Panel scroll bars as well.
You can work with both any number of lines at a time. Use CTRL+A to select all lines. Use standard methods for working with lists for selecting several lines.
Image
Press DELETE to deactivate all selected filters.
Press SPACE, check the checkbox or use the context menu to invert the state of selected filters.
Canny Monitor Log
The Log is situated under the Control Panel. It displays messages in chronological order, I.e in the order they were received in. Only entries that pass through the active filters are logged.c
Image102
Pause/Resume by pressing Pause
Log display format
Image
0x35a 0x00 0x00 0x25 0x6f 0x25 0x6f 6844756 ..%o%o..
a b c d e
a. - message identifier. Can be viewed in standard (11 bit) or expanded (29 bit) modes for CAN. For LIN it is always 6 bit.
b. - fields containing message data bytes
c. - filler in case the message is shorter than 8 byes.
d. - timestamp of the message, decimal, in milliseconds from the moment Canny Monitor was launched
f. - displays the received data in ASCII
Saving Log entries
Information from the Log can be copied to clipboard and inserted into a text file or a spreadsheet. Alternatively you can save the Log to a text file directly, by pressing File→ Save or the corresponding toolbar button. The resulting files may be used for further data analysis.
Command Line
Command Line is situated under the Log. It can be used to send data to the CAN bus.
Note: Sending messages to the LIN bus is not part of Canny Monitor functionality.
Command Line message format
Image
002 10 1f 00 12 00 00 00 00 eff repeat 2
a b c d
a. - CAN message identifier in standard (11 bit) or extended(29 bit) format;
b. - data bytes of the CAN message. You can send between 1 and 8 bytes per message. The length of the message is determined by the number of bytes written in the send command, including bytes with a value of 00;
c. - (optional) identifier of extended ID format. Needs to be used if the user needs to send a message with an extended identifier.
d. - (optional) repeat and repeat quantity parameters. Set when a message needs to be sent multiple times in a row. The number of repeats is in decimal.
Quick repeat/edit a previously sent command
All commands sent via the command line are saved by the utility. Use the dropdown list or up/down arrows on your keyboard to navigate the saved commands.
Status bar
The lowermost line in Canny Monitor is the Status bar.
The status bar displays the following information:
Image102
a. - current connection configuratio; b. - controller connection status; c. - CAN/LIN error and overflow status; d. - USB error and overflow status; e. - inbound and outbound USB data packet counter g. - the practical data transmission rate between the controller and the PC
The context menu is called using the right mouse button. The exact menu called depends on where the user clicks.
Control Panel context menu
Image
Copy: copy to clipboard
Toggle: toggles the selected filter
Uncheck: disables inbound messages from the selected identifiers.
Columns to Cotnents: sets column width to match column contents
Clear: clears the Control Panel
Log context menu
Copy
Select All
Clear